Cloud-based automation and BI for a travel business
How we helped a travel business shift to cloud‑based automation to streamline data transformation, improve customer analytics and BI, and foster a stronger data culture – enabling quicker decisions and lower operational costs.
Case Study: Cloud-based automation and BI for a travel business
Results
Transitioned to quicker, lower-cost cloud-based data pipelines
Delivered a range of tailored PowerBI dashboards to replace manual reporting
Empowered a data-driven culture, enabling future projects
Executive Summary
We designed, built, and handed over a cloud-based environment in Amazon Web Services (AWS) to automate the transformation of the client’s data at an extremely low ongoing cost.
We eliminated the need for time-consuming manual reporting processes by introducing Power BI dashboards that collated and showcased insights from across the business, helping to assess value and opportunities.
We worked cross-functionally with the client’s team to inspire a stronger data culture, fostering trust, advocacy, and engagement with analytics across the business.
Introduction
Following steady and sustained growth over the past 4 decades, our new client found themselves hitting something of a block in the road in 2020. As a B2C travel business, they were one of the many verticals hit hard by the precariousness of the pandemic.
Facing the introduction of new regulations, restrictions, and a consequent shake-up to the seasonal behavioural trends they typically rely on year-after-year, this roadblock brought on the necessity to understand the changing market and the ability to tap into the opportunities there.
The Challenge
Sifting through the client’s pre-existing data, our expertise allowed us to quickly spot an opportunity to capitalise on some existing data. A common circumstance – the client had an awareness that the organisation was data-rich – their limitations however was: a lack of process, valuable skills being thinly stretched internally, and investment being tight given the economic backdrop.
Upon inspection, it was clear that the client’s systems produced text strings that intertwined behavioural information with characters and numbers that – for analytics purposes – muddied its value and introduced layers of noise that needed to be isolated. This ‘noisiness’ of the raw data made full-fledged investment into analytics seem like an arduous task for the client’s team. As a result, valuable insights were simply slipping through their fingers day-by-day
How We Did It
Recognising the need for a solution that brings together key areas of the business, from marketing to digital to sales and commerce, we worked with the client’s Head of Our approach 1 Digital, Head of Commercial, had branch and operational team engagement (with a 75% digital focus) to scope out a 3-week project that undertook: a full sweep, clean, and structuring of the client’s data; the build of a custom Power BI dashboard; Data Engineering and Data Strategy-based support for the implementation of that work; plus, using our years of experience serving long-standing clients in the same industry, a range of dependable recommendations to improve their reporting processes, analytics set-up, and tracking to name just a few.
As 2020 began to draw in and streams of whitepapers, reports, and blogs addressing how to navigate in a new, radically changed market, our client had now found themselves sooner-equipped with the most relevant source of information of all: clean, structured, first-party data captured directly from their business’s digital touchpoints.
By choosing to enable predictive analytics with our team early on in the year, the client was afforded the opportunity of a data-led, pre-emptive strategy that considered their customer’s changing behaviours, their organisation specifically, and the new trends in travel that were emerging close to the business.
Our Approach
After an evaluation of BI tools, we focused on Power BI due to the client’s familiarity with the tool – We never leave clients with solutions they aren’t equipped to begin using immediately or would struggle with in any way.
However, while easy to use, Power BI can be tricky to implement; There may be gateway issues, IT teams may have to get involved to grant permissions, and overall, set-up can be advanced due to the complex nature of Microsoft environments within large organisations. This is where our cross-functional engagement allowed our Engineering team to be on-hand to support the client’s team, getting things up and running quickly, securely, and to a very tight deadline.
People are central to our process. We understand that part of investing in a bespoke product is the guarantee that you are brought along for the journey, your thoughts are encouraged, and compromises can be made if needed. So, throughout the design, build and implementation of our solutions, an iterative approach is undertaken to ensure that we are striving for better and that all stakeholders are happy.
So, naturally, following our first stakeholder review session, we had requests for additional metrics, additional views, etc. – As put by the client’s Head of Digital, imaginations had been sparked throughout the team. We often find that our inclusive approach brings about trust and advocacy, fostering a higher level of engagement from client teams.
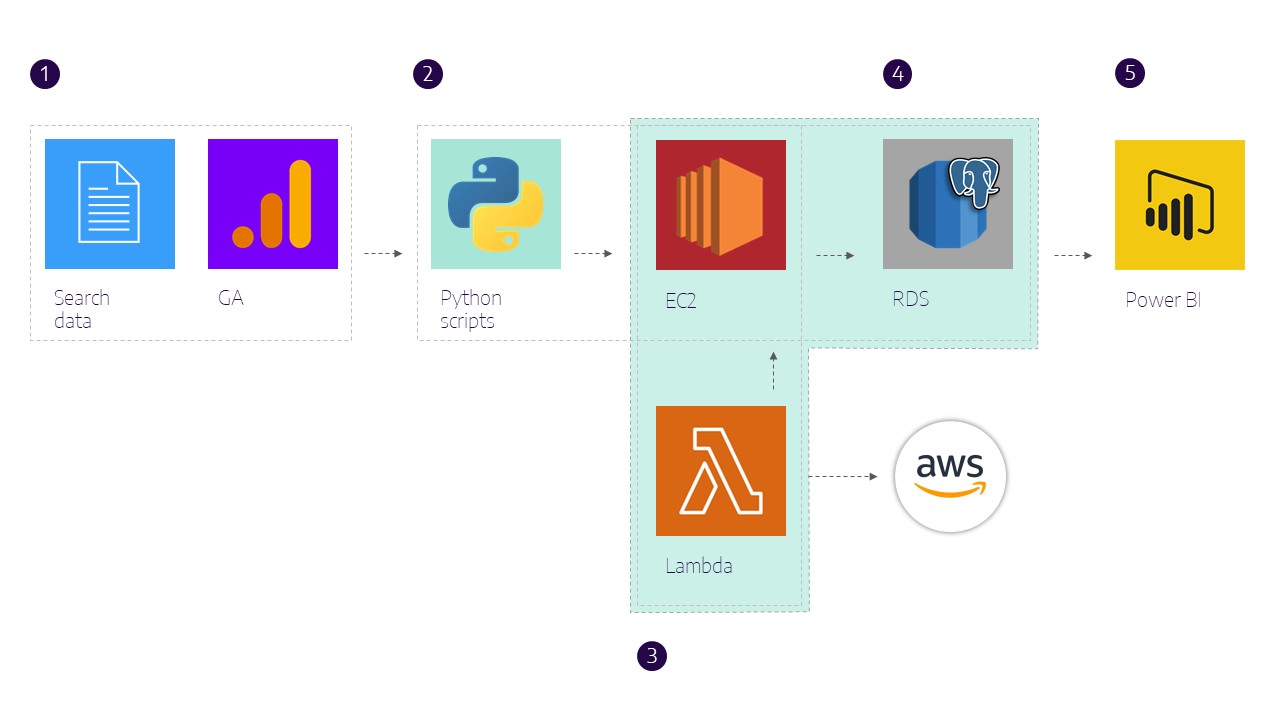
The Technical Solution
Google Analytics (GA) contained the client’s highly cardinal search data (millions of possible combinations of search parameters)
AWS’s EC2 holds the Python scripts that pulls data from the GA API, cleans it, then writes it to a Postgres database
AWS’s Lambda stops and starts the EC2 instance to reduce running costs
AWS’s RDS contains the Postgres database
Power BI pulls data from RDS/Postgres and hosts the client’s dashboard
Key Insights
Historically, the client’s market relied heavily on seasonal norms and some textbook behaviour from a few key customer segments. However, as their new feed of analytics now was proving, in the wake of the 2020, the rules had been turned on its head. Older customers were suddenly seizing the day with big trips abroad, young people were tentatively searching for short getaways much further out into the future and the most popular destinations being searched for was anticipating as much as responding to changes in travel restrictions.
These trends – through the client’s improved BI pipeline, new SQL databases, and from the removal of manual reporting processes – were now demonstrable and ready for the team to capitalise on each day.
Data points that specified: location, customer type, destination sought, route, search demand, etc., were coming together across the client’s digital touchpoints to build a picture of a paradigm shift in consumer behaviour. These new insights were also helping to prove the performance and value of investment-starved channels and facilitate the analysis of complex customer journeys.
As noted by the client’s Head of Digital “[the project] highlighted the potential to get more out of our data and has given us a case for more investment in analytics” “[our work with Lynchpin] unlocked our ability to demonstrate where the trends are and action them. It will also help us to better plan and optimise our campaigns moving forward”.
Setting Up for the Future
Cut forward to 2021, the client is in the early stages of their analytics maturity journey. Their new stream of insights shattered preconceptions or any speculations that the team had about how they were going to tackle the turbulent year gone by and allowed them to take full control with planning and decision-making.
Keen to continue fostering a stronger data culture, the opportunities are truly endless with clean, structured data. This immediately enables a range of low-effort but high-impact opportunities like cross-selling, up-selling and responsive targeting.
And building on that deep-dive opportunities such as customer look-a-like modelling, automation, and data consolidation to enable trending, benchmarking, and forecasting; In a little over 12 months, the client’s team has used analytics to totally transform their thinking in a new direction that is now in line with leading organisations all around the world.
Lynchpin help us unlock the millions of data points we have and turn them into valuable insight, which we use on a daily basis to improve our traffic, customer journey and sales performance. Their data scientists don’t just support our internal data and analytics team, they are genuinely commercial and committed to understanding our business, which means the outputs are always in line with our company strategy!
They have worked alongside us for ten years to support our data maturity and had a major impact in turning us from a company with data, to a data driven decision making company. We value our relationship with Lynchpin and fully expect our partnership to be a longstanding one.John Donnellan, Senior Director of Digital Strategy, Operations & Marketing, Canon EMEA
For over eight years, Lynchpin have provided expert support across the web analytics’ piece for John Lewis Finance. Whether it’s building actionable dashboards, advanced reporting and visualisation, deep dive analytics, data engineering and tagging specs, or designing complex attribution models, Lynchpin prove themselves again and again as highly experienced and competent. They have led and driven our analytics strategy and played an essential role in our business growth. Highly personable, their consultants are well known within the office and I would recommend them as a trusted 3rd party business partner.Adam Taylor, Partner & Web Manager, John Lewis Financial Services
The PRISM model guides organisations and marketers to move towards not just identifying and satisfying customer requirements, but using data and analysis to anticipate and predict their needs.Michelle Goodall, Social Media & Digital Transformation Consultant, Econsultancy
We have partnered with Lynchpin for several years now and they have played a key role not just in delivery of day-to-day and project-based initiatives but also in development of our solution design and data collection architecture. Lynchpin’s depth and breadth of expertise and experience as well as their non-partisan ethos – not being tied to specific solution providers – has enabled us to understand both the benefits and the potential pitfalls of different solutions and designs. As a result we have very solid data quality and that’s reflected in the quality of the insight we are able to serve to the business. The team at Lynchpin are flexible, supportive and great colleagues to have. They are a highly valuable part of the extended LexisNexis team.Michele David, Lead Product Owner, LexisNexis Risk Solutions Group
Over the past 5 years, I have worked almost continuously with Lynchpin on various data engineering and analytics projects. They are adept at navigating complex business requirements and helping you to really ‘look under the bonnet’ and understand the power of your data.
We have a great partnership with the team at Lynchpin, they are a valuable support to our business strategy with their extensive experience and knowledge of data engineering.
Throughout a complex website re-platforming project which combined a standard and subscription customer proposition, Lynchpin helped us build an analytics infrastructure which not only met the brief it also went that extra mile to future-proof us.Michelle Corp, eCommerce Director, Lily’s Kitchen
We have enjoyed working with Lynchpin for a number of years now and they very much feel a part of the team. Their in-depth analytics expertise and experience, alongside the ability to fit in with our ways of working have proved invaluable to us.Adnan Chaudhry, Vice President of Marketing Analytics, Research & Planning, Emirates
More client success stories
As an independent, full-service analytics consultancy, our team are flexible – equipped with a range of practical experience, skill, and commercial awareness.
If you’d like to explore how we can help, please get in touch with our data and analytics consultants. We don’t have salespeople and your first point of contact will be a subject matter expert from our leadership team.