 On 23rd November 2016, we were once again back at Zero-01 in Soho for Web Analytics Wednesday and this time we had three great presenters from the world of data and analytics and two different famous publishing houses Time.inc and The Economist.
Businesses always like to know how their content is performing and if it is driving engagement or even nudging people closing to purchasing a product or service. For many organisations the content is there for a specific reason for example to share information and drive persuasion. However when your product is content and the consumption of that content is critical for survival, measuring its success is fundamental.
We were delighted to welcome Lee Wilmore, Head of customer intelligence from Time.Inc and his colleague Crystal Zhao, Digital Analyst who spoke about content engagement from several perspectives including segmentation and personalisation.
Our first presentation was Bobby Gill, Data & Digital Analytics Director at The Economist who presented on how The Economist wrote a five year plan and proof of concept to create a centralised agile data environment. Bobby talked us through the time it took and how he went about connecting the technology – fascinating stuff!
How The Economist centralised its data.
This year’s Measurement and Analytics survey revealed that only 4% of companies had a 4-5yr analytics strategy documented.
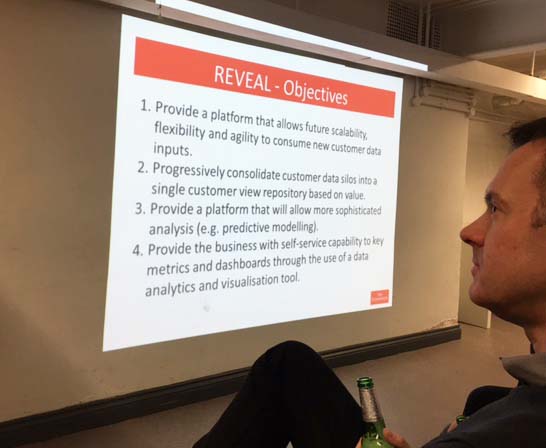
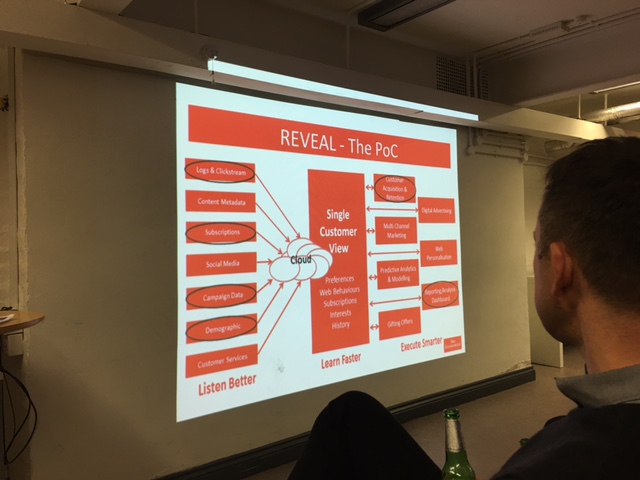
Last Year Bobby Gill embarked on a project to consolidate the data The Economist holds in order to make a central repository (removing siloes) and allowing a better view of the customer, ideally a single view. It was clear that he needed a scalable data platform that would also allow for more sophisticated analysis such as predictive analytics, with a more self-service model where teams could access key metrics and dashboards through the use of a data analytics and a visualisation tool.
 However before the project could get off the ground Bobby needed to produce a proof of concept and make sure it was cost effective, work across the organisation and get the budget signed off. The stakeholders at The Economist were interviewed in order to prioritise what was important to them (KPIs) and the insights they needed.
The Data platform was created using Amazon web service , google sheets bringing in the data with various rules created in SQL, Spark and Looker overlaid.
The results of this innovative approach to data were impressive!
With the data in one place and with one clearly defined toolset, costs have reduced, there is less data preparation required and importantly the data is trusted. As a result, the end users of the data have been empowered to find new insights.
Data is now seen as an asset and its importance elevated and imbued into the company. Indeed there is now a member of the Data Team on the board and Bobby reports to the Board ever other meeting.
 For the first time analysis can be achieved to measure cross platform usage. The circulation team are able to accurately determine impact of registration and digital usage on conversion and retention. Editorial can determine how well content is received and can tie together insight to decide what features to develop to increase usage. The media sales business can understand which customer profiles exist on various platforms to feedback to potential advertisers and this is powerful sales tool.
Our second presentation was from Time.inc.
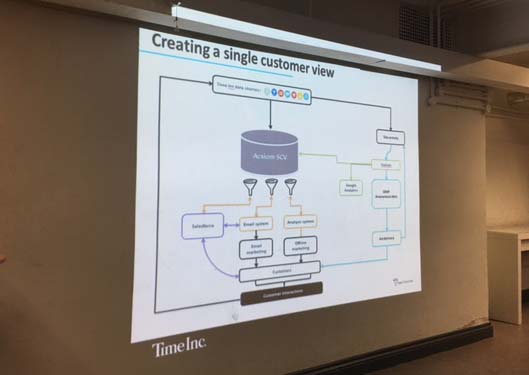 Time.inc increasing engagement
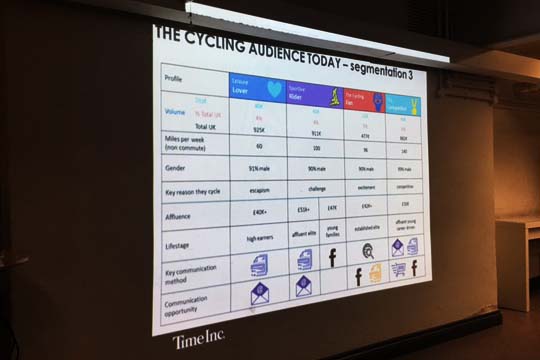
Time.inc have many brands and have many customer profiles across those brands. Time.inc focus on creating content to feed peoples’ passions, whether they are beauty junkies, golfers, cyclists or knitters to name just a few.
Increase engagement by understanding the customer.
According to Time Inc, better targeting often means better engagement. Editorial and customer engagement is a two way street – If you create the right content there will be better consumption. If you understand what the customer wants and responds well to, you can create more of that content and send it to the customers that it’s most suited to.
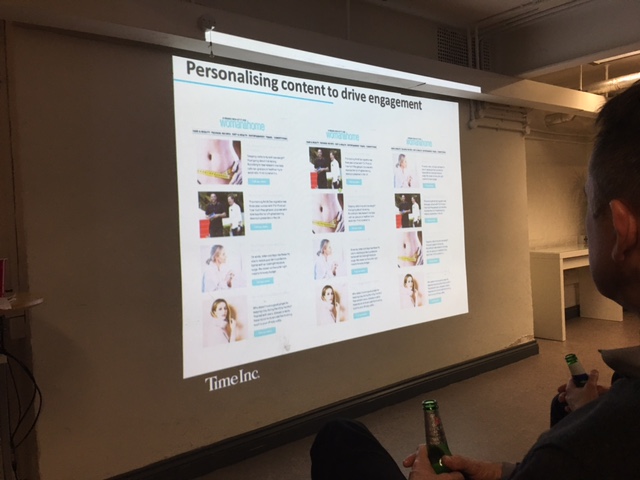
 This includes some personalisation. For example ordering content on emails depending on what the customer has shown most interest in, in the past. In another example, Time Inc showed how in a women’s publication they use images that reflect the age group of the reader to promote cosmetic products that suit those people better.
 Detailed Reporting and interpretation – Understanding performance of content
One of the challenges Time.inc had was separating out older content and the newer stories that need to be actively promoted. Crystal talked us through a brilliant case study, of a review site with a lot of ‘evergreen’ content that drives search traffic. However the immediate interest is how well fresh content is working to allow the current staff authors to understand key action priorities across social media and how their own stories are performing against their colleagues. Because it is a review site, and content refresh is a priority, this report serves to show which reviews are still of interest and therefore prioritise.
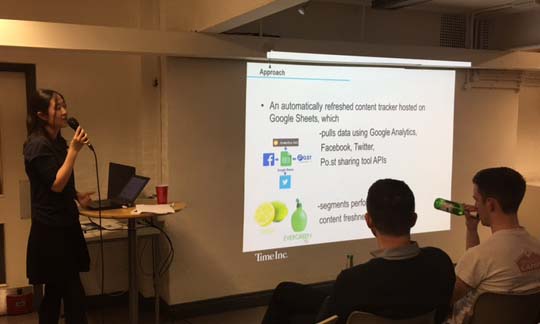 New and updated stories are measured in terms of how they generate traffic, new audience acquisition and relevance as indicated by social media referral and onsite shares.
Authors are able to identify all their pages in one place, and are expected to understand and improve their stories’ traffic contribution, missed opportunity in social and content recirculation, average consumption on multi-page stories.
This report has had a massive impact for Time Inc.
- 144% uplift in UK new content readers and 196% uplift in UK landings on new content, Oct 2016 vs. Jan 2016, with similar amount of stories published monthly.
- 200% increase in stories updated, with 258% more users and 289% more sessions on updated stories.
- Old stories receive an 18% uplift on users.
It’s clear that to survive the scourge of content overload, free blogger content and the declining consumer interest in the magazine market modern publishers need to understand customer behaviours and develop personas in order to best serve their audience. This also drives innovation in products and helps to understand which publications can be created or new concepts developed. With all of these things in mind, both the Economist and Time.inc use data science and analytics to adapt and predict the changes they need to make. It’s no longer all about time on page.
To find out more about Web Analytics Wednesday
To download the Measurement and Analytics report go here.