Alistair Forsyth, Senior analyst and Cameron Gray, Data Engineer attended the London leg of the Tableau on tour conference over two days 14-15 June 2016. We use Tableau everyday to blend data sources and create visualisations that help our clients convey insights across their organisations. Here are five takeaways from the two days.
Tableau 10 – Launching August 2016
We are currently officially using Tableau 9 and 10 is due out at the end of Summer. We are trialling some of the beta updates. Tableau have a list of improvements including an improved server experience and completely redesigned interface. The most exciting update is the application of cross-source data filters, eliminating the need for a complicated bit-part solution.
Tableau 10 – We joined the beta data revolution have you?
- With Tableau 10 being launched this summer there was of course a top features list covered. At Lynchpin we’ve been playing with the Beta version already, and it certainly fixes a few quirks of the past! Cross-source filters (natively!), in-built clustering (although only using k-means), customised dashboards at a device view level giving an enhanced experience no matter what device is being used.
- Version control for data sources, browser based dashboard authoring and extract failure notifications are just a few of the other features that are coming soon. These all combine to ensure that dashboards are kept up to date both from a data perspective and also have the ability to be customised effectively and timely to meet client needs.
R Integration
- This isn’t a new feature by any means, but one that was talked about a lot at the conference. Integrate R through calculated metrics within Tableau, referencing any script or plugin to push the boundaries of data manipulation beyond the set functions in Tableau.
- With customers starting to think about utilising the large data sets available, R is a natural option for both initial data manipulation and more advanced techniques (think statistics!). It’s of no surprise that Tableau are highlighting their native integration with R, taking advantage of the outputs and being able to plot them directly onto dashboards.
Tableau on Linux
Tableau 10 will also be available on Linux, for all those out there that prefer the open system. Linux users tend to be a more experimental crowd and the community have been demanding availability on Linux and so Tableau finally obliged. It will be great to see what Linux fans create.
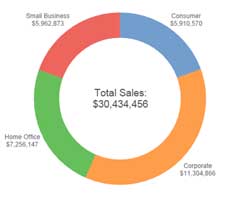
Donut Charts – Who doesn’t enjoy a donut? Time for a larger waistband.
Okay, maybe not ground-breaking, but a nice way to show data! Create a pie chart, with the labels set on the outside. Then create a separate pie chart that totals all the data and put it in the middle. Voila – a much more useful version of a piechart!
Web Data Connector
- Introduced in Tableau 9.1, the Web Data Connector allows Tableau to connect directly to data sources on the internet. Traditionally, data would need to be retrieved and stored in a format that Tableau can read, either manually or through the use of an automated script, using a Web Data Connector removes this step.
- A Web Data Connector consists of an HTML page which contains some Javascript that retrieves the data and returns it in a format that Tableau can parse. Web Data Connectors can be hosted on a regular webserver and shared by simply sending the URL to people who want to use it. There is also a huge library of Web Data Connectors that other people have made publicly available on the internet such as at tableaujunkie.com. Using these is as simple as telling Tableau to add a new Web Data Connector and pasting in the URL.
We look forward to next years conference.
Read more about our data visualisation services here and get in touch here