
Power BI can be an extremely powerful tool, but like any software there are a few tricks that can really help you get the most out of it. If you’ve ever found yourself spending hours painstakingly perfecting your reports to make them publication-ready, we’re here to offer a few Power BI tips!
1. Formatting Entire Reports Using Themes
Despite the best-laid plans, there will likely be times that you need to make formatting changes quickly and consistently throughout an entire report, be that a change in font, a change in brand colours, or even just tweaking the palette to add contrast or be more colour-blind friendly.
Previously, the only way to do this was to write or modify a JSON file, which can be a bit daunting. However, first previewed in the December 2019 update, the “Customise Current Theme” feature can be a much quicker and easier approach.
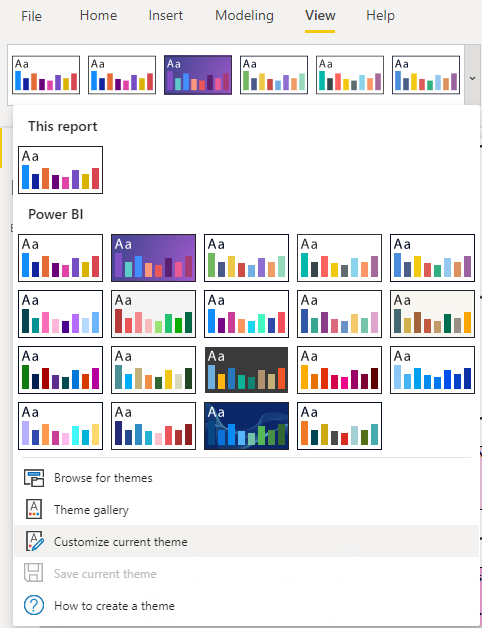
To access the customisation menu:
View > down arrow next to Themes > Customise Current Theme
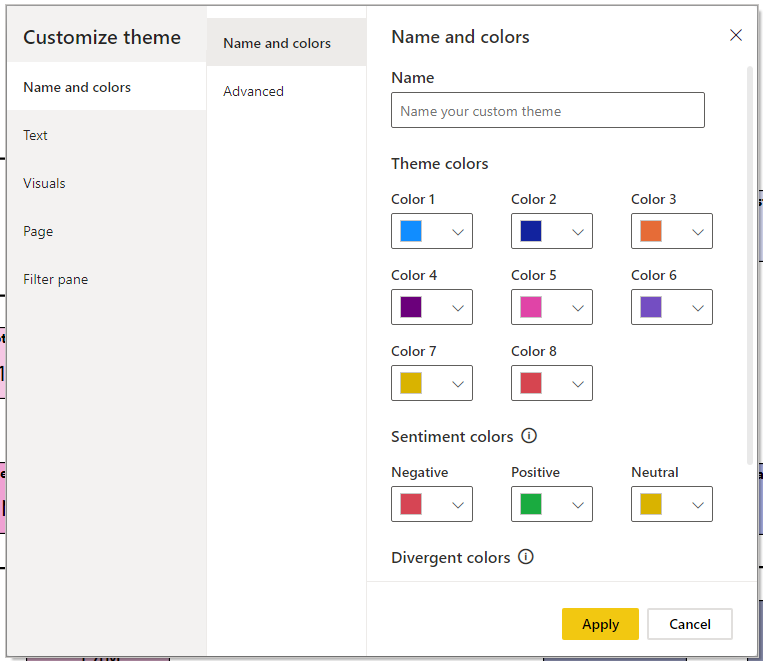
There are a lot of different options to explore in the customisation menu, the details of which are beyond the scope of this article.
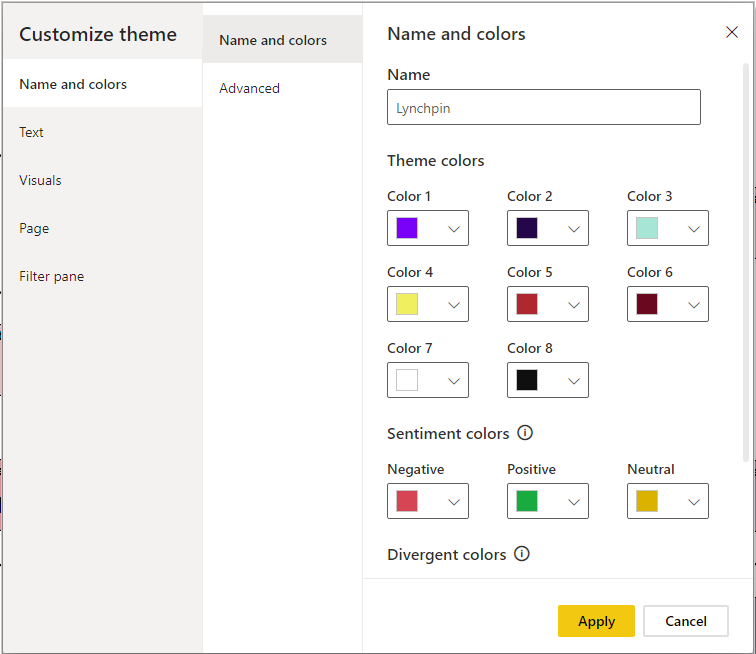
For this example, We’ve created a palette using Lynchpin’s brand colours. When we apply the changes, anything in the report that is using a hue of Colour 1 in the existing palette will be changed to the same hue of our new Colour 1, and so on.
To apply your changes, just click Apply.
An added bonus is that once you’re finished customising, you can save the theme to a JSON file, which can then be easily imported into your other reports in a couple of clicks.
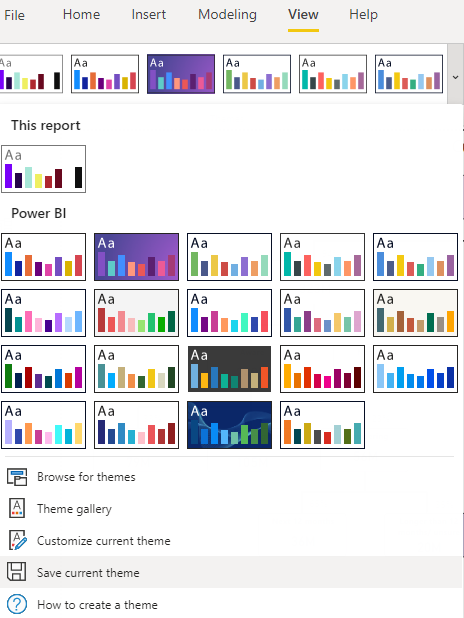
To save your new (or modified) theme for future use:
View > down arrow next to Themes > Save Current Theme
2. Formatting Elements
Another common pain point is the need to make change or set of changes to several elements quickly and consistently.
Let’s say we wanted rounded corners on the card elements. We’re going to look at a few different ways to do this:
2.1. Format Element Separately
The most basic approach would be to make the same change to each element one by one:
Unfortunately, this method becomes extremely time consuming if you have a lot of elements to reformat and could also be prone to inconsistencies.
2.2 Customising Your Theme
Alternatively, you could make the changes in the theme customisation menu:
This would work if you wanted the change to affect all elements in the report, but in this example, we only want to affect the card elements on this single page, so this method wouldn’t be suitable.
2.3. Format Painter
Your next option is the format painter, which works similarly to in other Microsoft Office products by copying the formatting settings from one element to another.
To use the format painter:
Click on the element you want to copy the formatting from > Home > Format Painter > Click on the element you want to copy the formatting to > Repeat for every element you want to format
An important property of the format painter is that it copies all formatting from one element to the other. This can be very helpful in a lot of cases, but makes it unsuitable for some others. In this case it means that we can’t use the format painter to copy across the changes to the border formatting without overwriting the intentional differences between the cards, such as different colours and number formats (which are adjusted so as to show 2 significant figures):
2.4. Ctrl+Click to Multi-Select
A way of isolating the formatting factors that you do want to roll out from those that you don’t is to use multi-select to choose which elements to affect, and then make the required changes.
To use multi-select:
Hold down Ctrl+click on each element you want to format > Make the changes as usual in the formatting panel
A few key advantages of multi-select are that it can be quicker than format painter if you have a lot of elements, and that you can make changes to some areas of formatting without affecting other areas.
However, a disadvantage is that it can get quite fiddly if you have a lot of overlapping elements and end up click on the wrong ones, or if you just have a lot of elements that you need to select one by one.
2.5. Lasso Select
A really handy new feature from the April 2020 Power BI update is the lasso select. You may be used to this from other Microsoft Office products, but it’s nice that it has now been rolled out to Power BI!
Lasso select can be really useful, depending on the layout of your elements.
As with the equivalent functionality in other products, the problem is in making sure you only select the items you want to select. For example, we couldn’t select all of the #cards on this report without also catching the other elements too. We can just about do row-by-row though!
On a side note, the lasso select can also be handy if you need to move groups of elements:
2.6. Selection Pane
If you do have a lot of overlapping elements (or if your company restricts you to an older version of Power BI), the selection pane will be really useful. You can either click on specific elements, hold Ctrl+click to select multiple, or use click > Shift+click to select a series.
This feature is most powerful if you’ve put in the time to name all of the elements in the report, and have arranged them in an intuitive order in the list. This effort is definitely worthwhile if you anticipate needing to make a lot of edits like this in the future, but for smaller projects can be more effort than it’s worth.
3. Custom Background Images
The last of our Power BI tips that we’re going to touch on is reducing clutter on the page. Having lots of static elements on the page that you don’t need to interact with (e.g. your company logo in the corner) can cause a number of inconveniences. To name a few, you might find that your reports loads more slowly for users, your selection pane is cluttered, or that you often accidentally select the wrong element when editing.
A handy trick to avoid these issues is to add the static elements to the background image.
For this trick, we need to create a temporary view of the page that only shows the elements that we want to push to the background. We can do this using the selection pane, which enables us to show and hide elements en masse:
To create your new background image:
View > Page view > Actual size > Hide all elements that you don’t want to push back > Take a screenshot of the canvas > Save as image
To set the image as the page background:
Delete or hide the background elements that you saved into your image > Show (unhide) the remaining elements > Format > Page background > Add image > Find your image in File Explorer > Image Fit > Fit
As always, the most appropriate method for solving a given problem will vary from case to case, which is why it’s good to know your options. On that note, perhaps one our most important Power BI tips would be to keep your Power BI Desktop on the latest version where possible, and keep an eye on the monthly feature summaries published by the Power BI development team here: https://powerbi.microsoft.com/en-us/blog/category/features/