One of the biggest changes in day to day usage of Adobe Reports and Analytics (formerly Omniture SiteCatalyst, AKA “the Adobe web interface”) is coming this year. It takes the form of a new metric selector and enhanced calculated metrics (also known as derived metrics). This was unveiled at the Adobe Summit, April 2015.
New Metric Selector
A big day to day weakness of Adobe Reports and Analytics is the metric mechanism. Clicking “Add Metrics” shows an antiquated selector – plagued by unhelpful groupings, a lack of descriptions for business context and an irritating drag and drop interface.
This is set to change shortly, with a new selector which mimics the segment selector. A sneak peak screenshot was shown (Above):
Derived Metrics
(the new calculated metrics)
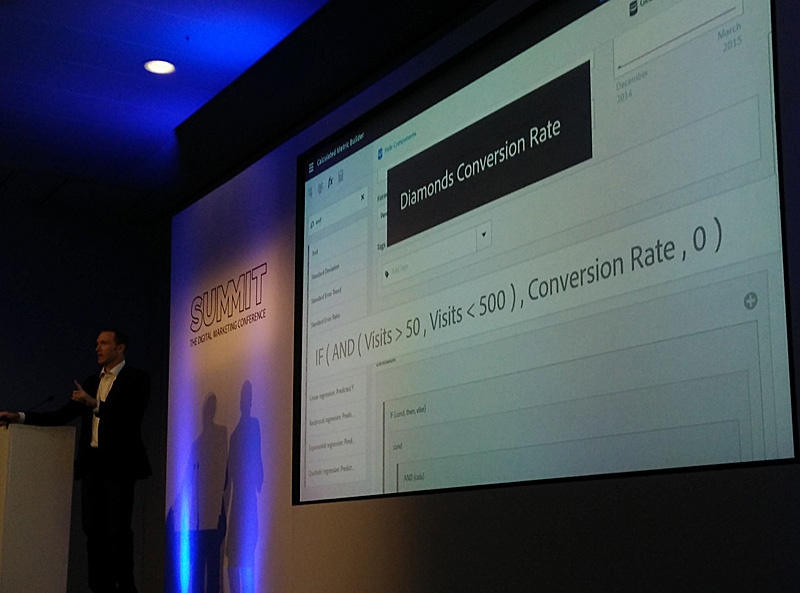
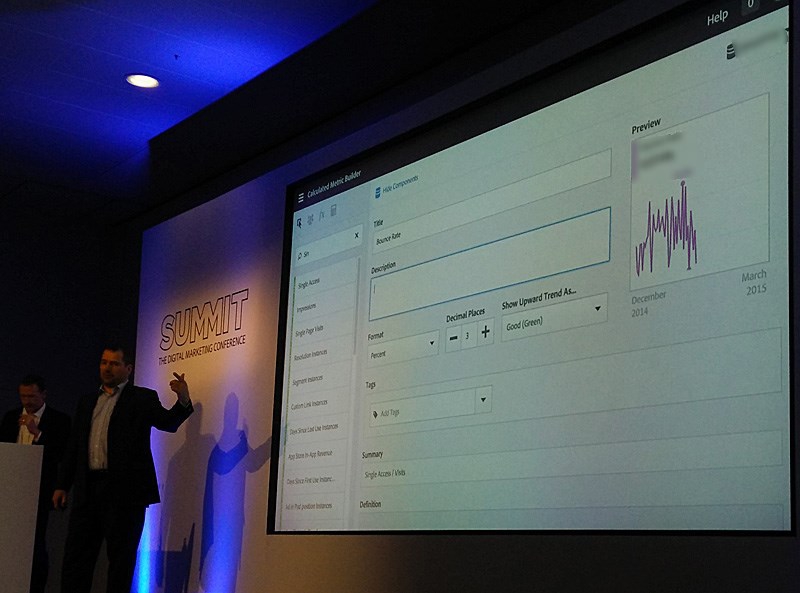
Alongside a new metric selector, calculated metrics are getting a similar make-over. The new calculated metric creator will be very similar to the segment creator. The main changes are as follows:
- The ability to add a detailed business description for the metric. Adobe’s pro tip was: what’s it for? where should it be used? where should it NOT be used?
- The ability to add tags to group the metrics. Again, Adobe provided a pro tip: add the teams who will find this metric useful as a tag (e.g. marketing)
- The ability to combine logical operators, segments and aggregation to a calculated metric. A.K.A. Derived metrics.
While useful descriptions/tags are never a bad thing, it’s the derived metrics which excite us the most. Since Adobe introduced the new segment engine within Reports and Analytics, the ability to quickly compare and share two segments has been incredibly useful.
Unfortunately, the ability to only compare two segments is often hit. For example, comparing a specific aspect of performance for 3 different products. This would often lead to multiple reports needing to be shared.
Derived metrics allows the creation of a new calculated metric for each of the 3 products in our example. This results in the ability to easily view the three breakdowns alongside each other (shown in Ad-Hoc below):
Additionally, it can work in a similar manner to SAINT classifications to either:
- produce new metric definitions as a proof of concept, negating the requirement to change the tagging layer (be it Javascript, processing rules or TMS tags)
- alter existing metric definitions to remove data discrepancies. Adobe’s example was a good one; a “search” event no longer recording data due to the page URL changing, with a period of time before this was updated in the tag layer to reflect the new URL. In this case, a page view could be counted if the event was present or the page URL was equal to the updated URL on site.
One important word of warning. Altering a segment will affect any derived metrics which use it. In a multi-user organisation the implications of this should be fairly obvious! Adobe’s pro tip this time: tag your segments with which metrics they are used in (and vice versa). Good advice!
An additional nice feature are the logical operators. These have been designed to be very similar to what is available in Excel. The idea being that analysts used to hacking data together in Excel can now clean it up at source.
Lastly; derived metrics are currently available in Ad-Hoc Analysis. They will be coming to Reports and Analytics, the API and Report Builder soon. It is planned to include them in Data Warehouse after the initial release.
Closing Thoughts
The new menu system promises to be a big improvement for the Adobe user interface, we look forward to trying it out. Derived metrics are very powerful but should be used carefully – they may be able to smooth out data discrepancies, but nothing beats a well defined set of KPIs alongside appropriate and well built tracking layer.