
High bounce rates or low conversion rates can seem like a bit of a mystery at times – why not remove the guesswork and get a handle on how your website content may be affecting some of those metrics?
In this blog, we will help you to get started with Google Optimize – sharing some of our tips for getting the most out of the platform, explaining some key considerations when testing website content and reporting the results from those experiments.
What does the platform do?
Google Optimize allows you to compare the performance of two different pages using Goals and Metrics that are already setup in Google Analytics (GA), giving it a distinct advantage over other popular platforms like Optimizely and Visual Website Optimizer. It’s also free and, in many ways, easier to use than other platforms.
Can’t I just implement my changes then monitor how my goals and key metrics are impacted in Google Analytics?
Implementing changes to your website in a controlled test environment is important to ensure you can isolate the impact of the test from other factors that may be happening at the same time. For example:
Seasonality: Most websites have a degree of seasonality, whether these are peaks at particular times of the year (Easter, Christmas, Mother’s Day, etc) or more granular periods, such as time of the day or day of the week. It may seem reasonable to look at comparing different time periods (e.g. Christmas 2019 versus Christmas 2020) however, is your audience even the same this year compared to last, what other changes have you implemented over the year that may also influence the results of the test?
External factors: While some factors may be known or within your control, there are external factors that can affect website performance in different situations. For example, a shop selling outdoor clothing may experience significant changes in traffic behaviour as the weather changes or shifts in competitor pricing may have positive or negative impacts on its natural performance. Comparing your results to the trends you were seeing leading up to the test could be misleading and result in the wrong conclusions.
And many more – even within your own organisation, there are many factors that you may not have control over; changing channel mix and budgets, pricing and promotions, website outages or performance issues, the list can go on.
By endeavouring to set your test up in a controlled way you can be more confident that results seen are a product of the changes you are testing.
Setting up Google Optimize to successfully assess test performance:
Hypothesis:
Once you’ve decided to run a test then the first step is to build out your hypothesis. The hypothesis is a formalisation of the ideas that are intended to improve the performance of a website.
For example:
- Implementing Paypal as a payment option in the checkout will increase the ecommerce conversions rate of the website.
- Moving the Call to Action above the fold on the landing page will increase conversions.
- Increasing the line space spacing of the blog will increase scroll depth.
Choose the hypotheses that you think will make this biggest impact and are the easiest to implement. As soon as you have a hypothesis to test, it’s time to move onto setting up the test.
Types of experiments you can run:
Within Google Optimize there are a few options for experiments that you can run which will be explained a bit more below.
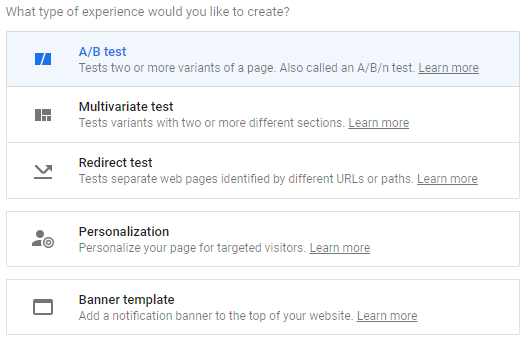
A/B test:
A test where a change is made to the page, known as a variant, compared against the original page. Changes to the page are made using a Visual Editor (Chrome Plugin).
Multivariate test:
This type of test is for when you want to test several elements on a page to ascertain how different combinations perform together.
Redirect test:
A redirect test allows you to set up a test using a URL as the test variant i.e. test this current page against this page, which can be found at this URL. This option is useful for complex changes or where it’s desirable to make the developer responsible for creating the test page on a new URL.
Personalisation & Banner template:
These two options are not tests but allow you personalise a page based on the targeting options available within Google Optimize. Likewise, the Banner template option allows you to display a banner based on the available Google Optimize targeting options.
Probability to be the best:
Google Optimize uses Bayesian methods to indicate how much a variant is winning shown as a percentage. So, 80% probability to be the best is how certain Google Optimize is that a particular variant is better than any other variant. Reaching this statistical significance will depend on how much traffic is directed to the test and how big the difference is between the variants. For example, a small subtle design tweak will generally take longer to surface statistical significance along with low traffic volume. It’s always a good idea to manage stakeholders or clients expectations around how long an experiment will need to run in order to reach statistical significance.
Setting up the platform:
We won’t touch on this too much as it’s covered very well in Google’s documentation. In short, there’s a default tag template you can use in Google Tag Manager – the only thing to remember is that this tag needs to be set to fire the GA Pageview tag first. You can set this in the Advanced Tag Sequencing section of the Google Optimize Tag i.e. before the Google Optimize tag runs, fire the GA Pageview tag.
It’s well worth installing the anti-flicker snippet that Google Optimize provides as a separate script which will prevent the user seeing the original page for a split second followed by the test variant. This script is placed in the header template of the website but before Google Tag Manager.
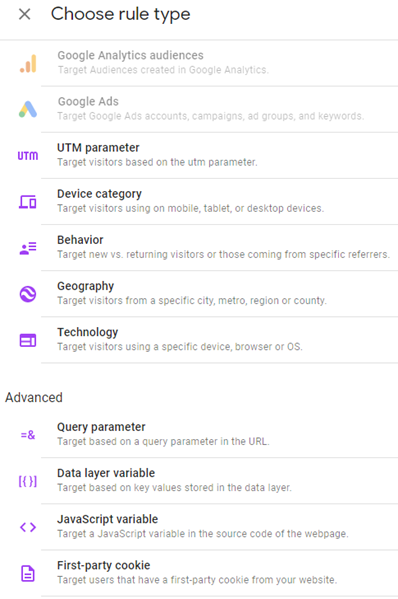
Targeting:
As you can see from the list below, Google Optimize has a good range of targeting options that allow you to control when your experiment runs. For example, only run the experiment for mobile, a specific region, Google Ads clicks or from traffic coming from a specific campaign.
Dimensions in Google Analytics:
Google Optimize will add a report to Google Analytics under under Behaviour / Experiments and it will send three additional experiment dimensions to Google Analytics:
- Experiment Name
- Experiment ID
- Experiment ID with Variant
With the new dimensions you can create custom reports and segment that data to expose insights that are not visible in Google Optimize. This is where an analyst should add value to the basic data that is provided by Google Optimize. Google Optimize will simply indicate which variant performs best across all devices, locations, and channels. Here are a few segmentation ideas to get you going:
How did the test variants perform across the following segments:
- Different devices
- Different marketing channels
- Different countries, if your site is international
There may be a specific country that is of importance to the company or there may be a product that is particularly profitable etc.
Keeping stakeholders in the loop:
Since a test can often run for a few weeks, it’s a good idea to send out a weekly report card to stakeholders with your results so far, including current variant performance & probability to be the best metrics.
Without some form of regular updates, people sometimes think nothing is happening!
Presenting the data:
While Google Optimize and Google Analytics both produce adequate reports that show the results of a test, clearer visuals can be produced in a dedicated reporting platform. This is key if you need to show the findings to board level stakeholders.
This group of decision makers need to be able to see the results quickly without any confusion or lengthy commentary. For this task, consider using Tableau or Google Data Studio to produce a visual that conveys the results in as clear a way as possible. Often the best visual is the simplest.
Where possible, show how revenue will be impacted if the winning hypothesis is implemented. Nothing stimulates action and board level buy-in more than increased revenue opportunities. For example, if the test is for an ecommerce site – the winning variant from the hypothesis increased the ecommerce conversions rate from 3.6% to 4.1% which over 12 months is an increase in £xxx,xxx revenue.
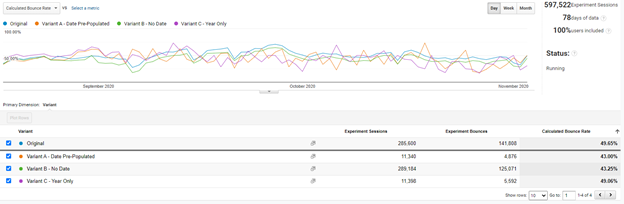
Google Analytics Experiment Report showing Google Optimize data:
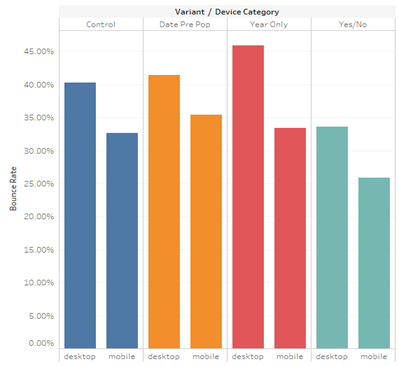
Graph in Tableau showing results across devices, where bounce rate was the KPI used for measuring test performance:
Key takeaways:
- Spend time working on a list of hypotheses, ordered by ease of implementation & expected performance gain.
- Ensure there is enough traffic to reach statistical significance.
- Ensure that stakeholders are aware how long the test may run for.
- Keep stakeholders updated on results with a weekly report card.
- Segment that data to surface hidden insights i.e. Mobile vs. Desktop, Locations, Channels.
- Where possible, show stakeholders the financial value of a winning variant.
- Present the concluding data in a platform that allows you to create the clearest visualisation, such as Datastudio, Tableau or Power BI.
For more information about our services, feel free to drop our team a message. And to keep updated with all of our latest blog posts and news, follow us on LinkedIn and Twitter.